Social Determinants of Health
BE 608
Final Presentations!
Looking forward to seeing what you come up with!
- Send me your slides by 3:00pm on last day of class (12/3) so I can get them loaded up (email is fine).
- I will randomly select one team for each payment reform topic and let you know that afternoon.
- If you are not selected to present, you will "discuss" the presenting teams research
- Did you find anything different in your research? Were there other aspects you liked to highlight? Or did you find the same results as the presenting team?
- Both teams will do Q&A
- Goal is ~10-12 minutes for presentation, another ~10 for discussion and Q&A
Final Exam
Our final exam is scheduled for Wednesday, December 10, 6:30pm-8:30pm.
- In this classroom
- 2 hours
- You can bring one page "cheat sheet" (8.5 x 11, 2-sided)
- Practice final (from last time) is on Canvas under "miscellaneous"
State Question
How did your state respond to the ACA?
Did you find any interesting health policies?
Health Expectancy Over Time
- Life expectancy 1900: 47.3 years
- Life expectancy 2023: 79.1 years
- Value of life expectancy increase from 1970 to 2000: $95 trillion -- 3x the amount spent on medical care.
Why did life expectancy improve?
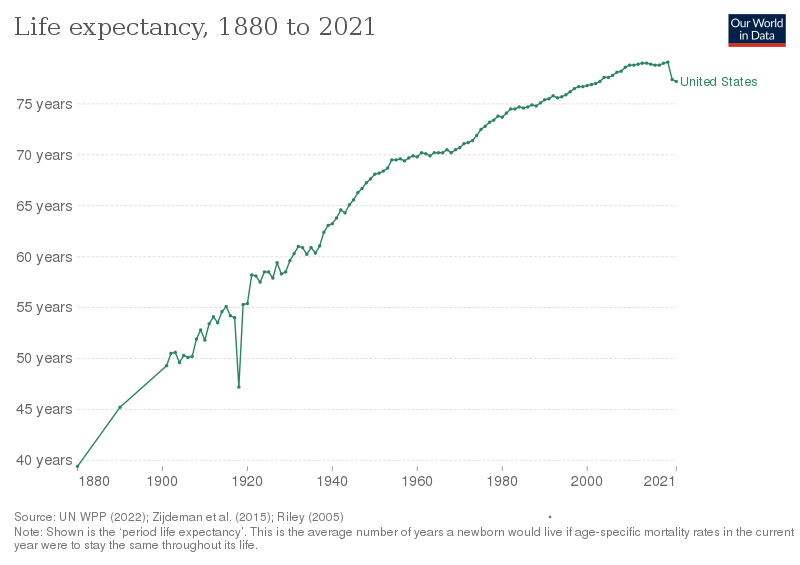
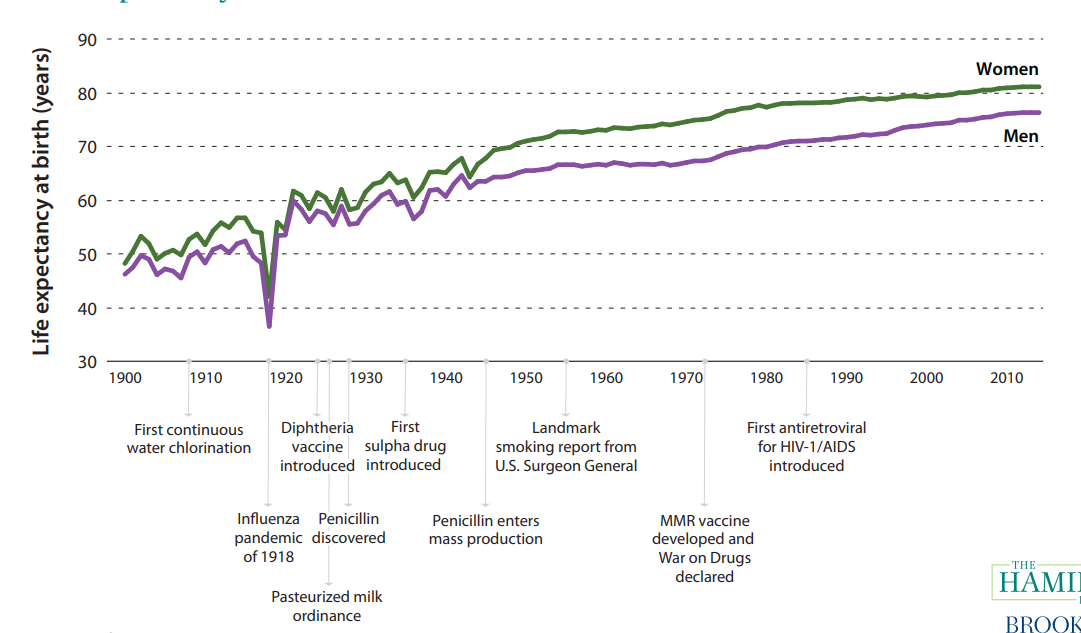
About half of the mortality gain from 1900 to 1940 due to water chlorination and filtration (Cutler and Miller 2005).
A large percent (10-15%, depending on source) due to improved nutrition.
Gains in later years partly attributable to decreased smoking rates and improved seatbelts/car safety
All are factors unrelated to "medical care" (as traditionally conceived)
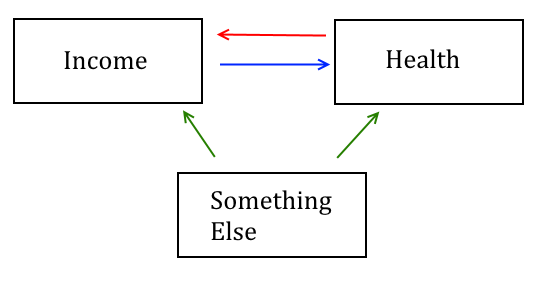
Income and Health
There is a strong relationship between income and health
- Emerges early in life (e.g., Case, Lubotsky and Paxson 2002 AER).
- Present in every country for which we have data, every time period for which data exists.
- True for many measures of health (longevity, obesity, chronic illness).
Income and Health
Income and Health
Chetty et al 2016 JAMA: Descriptive paper
- Uses massive data from tax records to describe income/health relationship in US.
- How has health/income relationship changed over time?
- What is correlated with health of the lowest income individuals?
Income and Health
Data on earned income:
- Tax returns for filers
- Sum of W-2 and 1099-G (unemployment) for non-filers
- Excludes social security benefits and disability benefits
Data on death:
- Social security death master index
- Look at individuals age 40 to 76
Income and Health
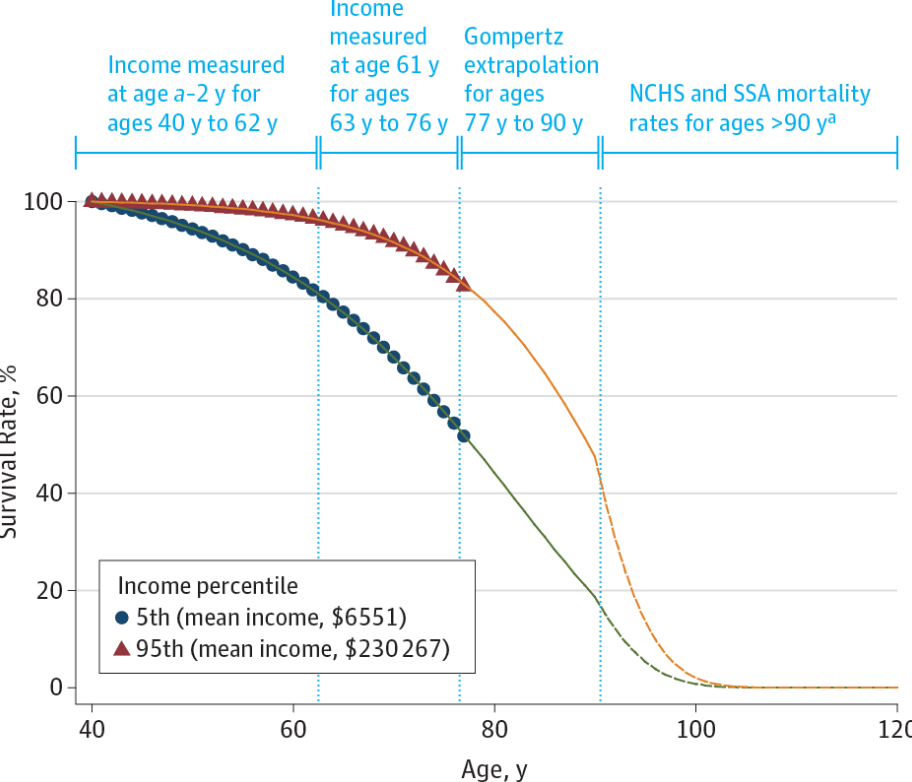
Methods
- Main outcome: life expectancy for each income percentile--"expected length of life for a hypothetical individual who experiences mortality rates at each subsequent age that match those in the cross-section during a given year"
- Conducted separately for men and women
- Used pre-retirement income percentiles to calculate earnings. I.e., for those over age 63, use their income when they were 61 to define their percentile.
- Adjust for racial and ethnic composition -- what would effects be if each income percentile had same racial/ethnic composition
Income and Health
Income and Health
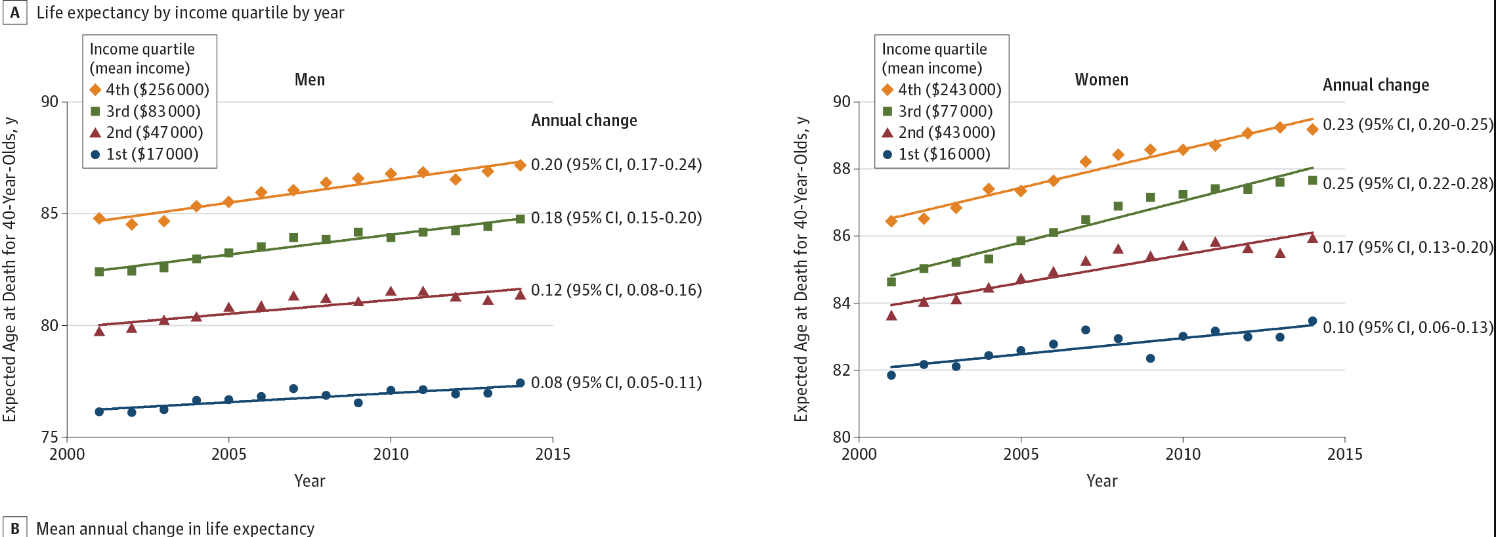
Life expectancy improvements are largest at the top, implying greater inequality over time:
- life expectancy increased by over 2 years for men/women in the top 5% but (much) less than 1 year for men/women in bottom 5%.
Income and Health
Text
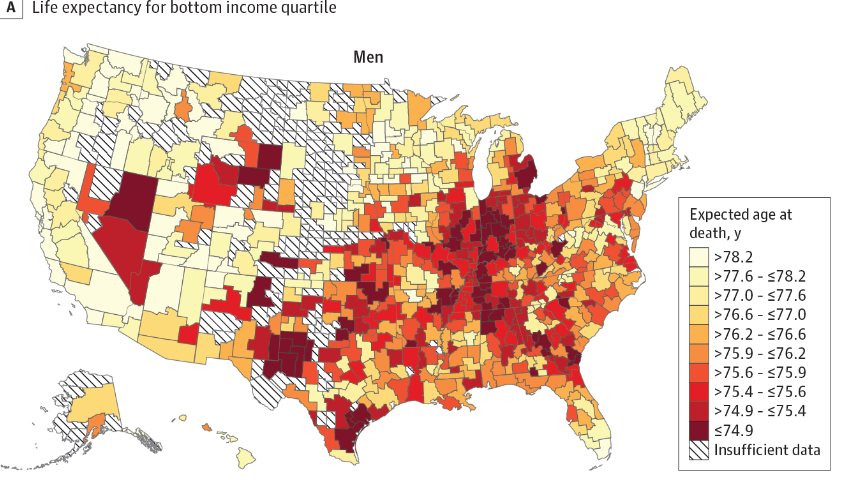
Some places particularly bad for low income individuals -- what is correlated with low life expectancy among low income?
Determinants of Health
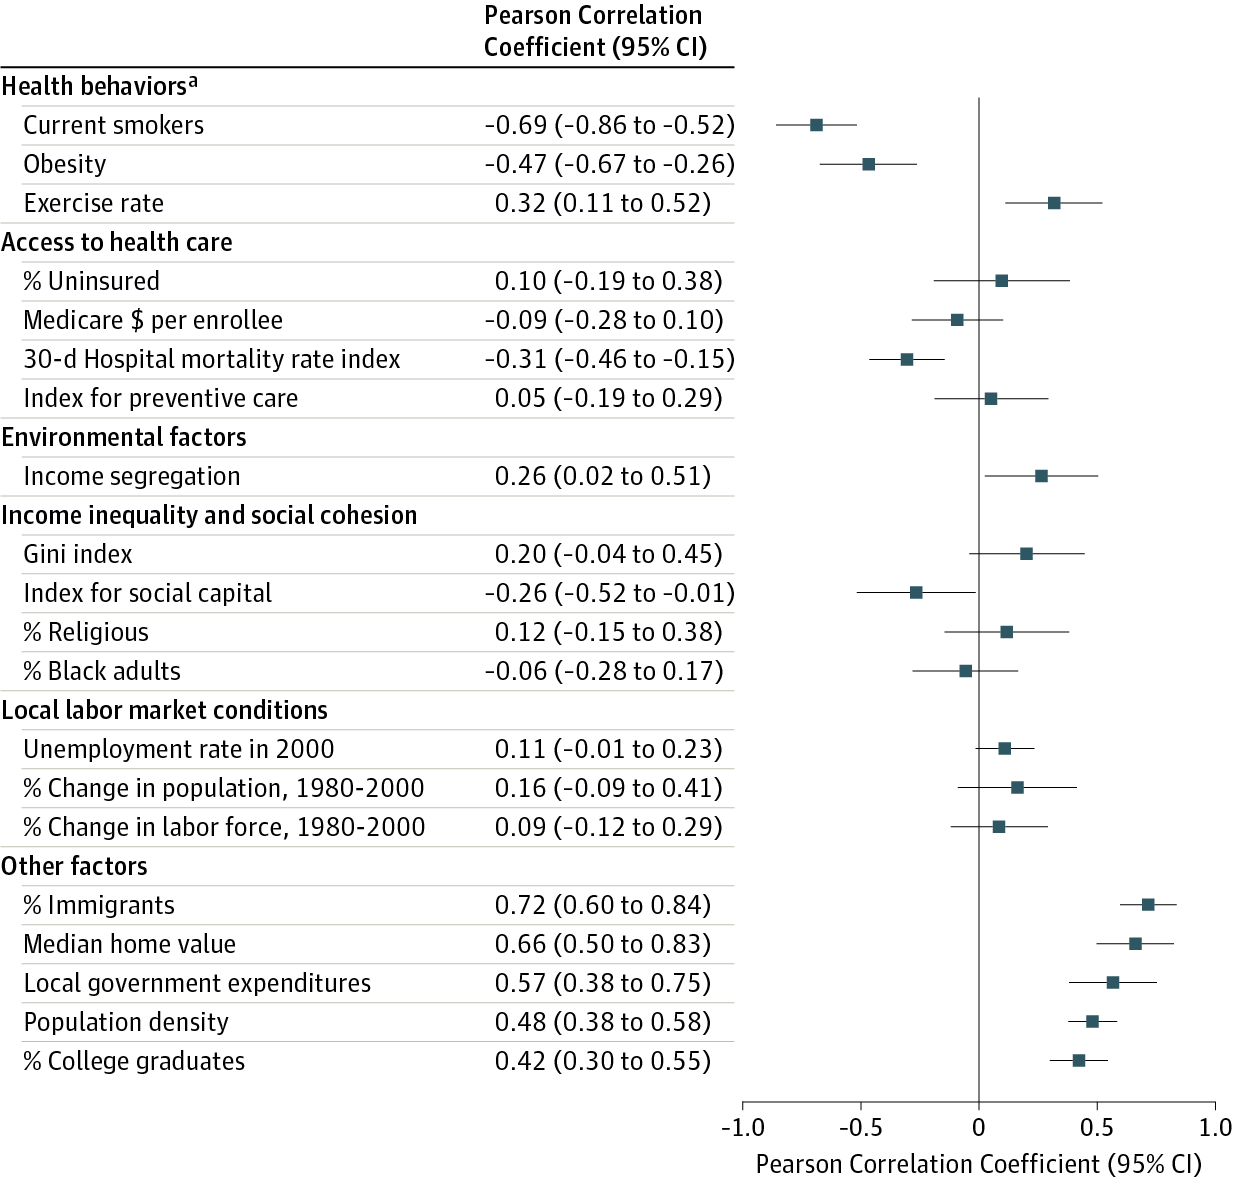
The strongest correlates of health expectancy are, for the most part, things that do not involve accessing and using medical care.
Strongest correlates:
- Health behaviors
- Demographic composition (education, immigrant presence, homeownership rates, etc).
Not correlated:
- Insurance coverage
- Amount of preventive care used on average
- Medical spending
Determinants of Health
Chetty et al 2016 shows that over time, high earners and low earners are experiencing health outcomes that are increasingly unequal.
Large gains for health for wealthy, stagnation or even worsening health for poor.
A Tale of Two Experiments
Oregon Health Insurance Experiment:
- Directly targeted health care access
- Significantly increased use of health services
- Somewhat inconclusive effect on clinical measures of physical health (some improvements in mental health and self-assessed health)
Moving to Opportunity:
- Demonstration for residents of government housing projects.
- Randomly selected families to be given voucher to move to low poverty neighborhoods.
- No direct health component.
- Biggest effects: improvement in health (lower obesity rates, lower blood glucose, fewer hospitalizations)
A Tale of Two Experiments
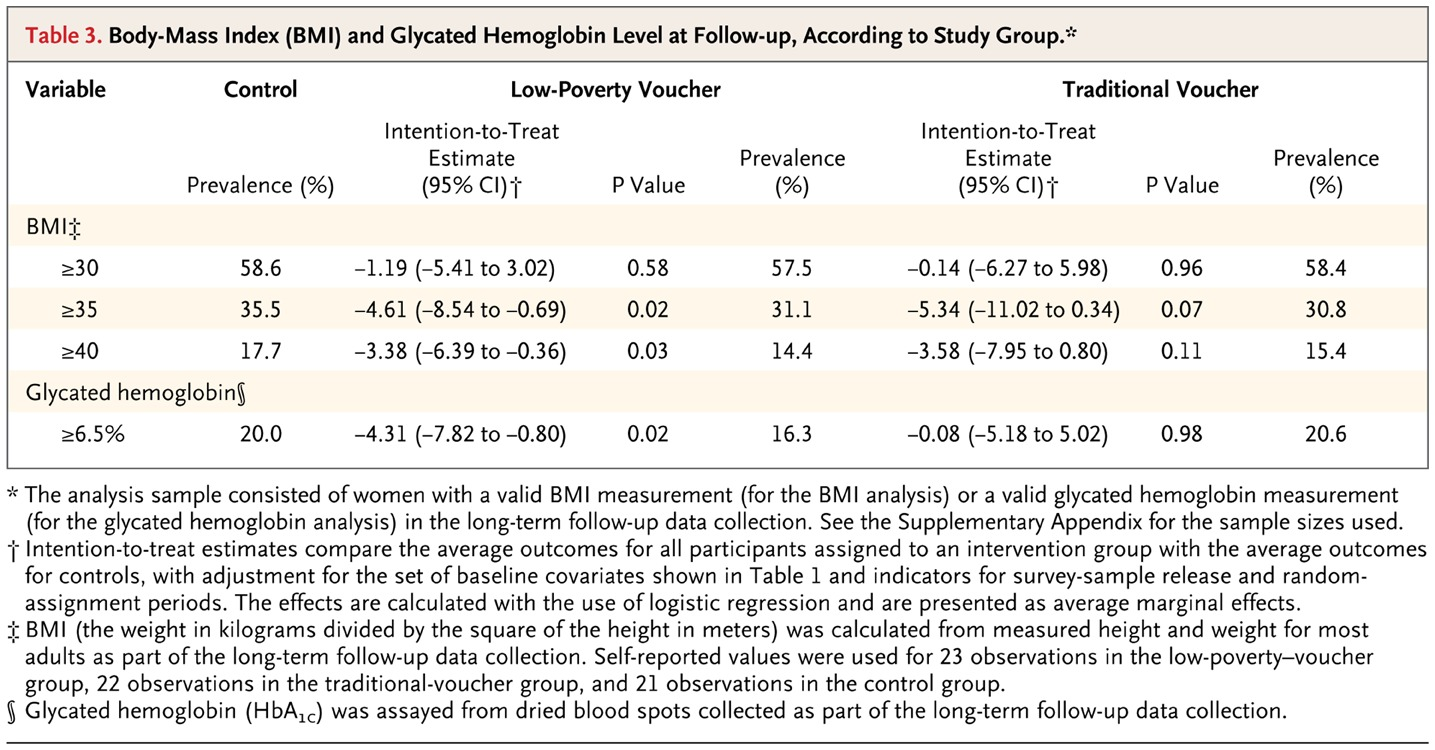
Ludwig et al New England Journal of Medicine 2011
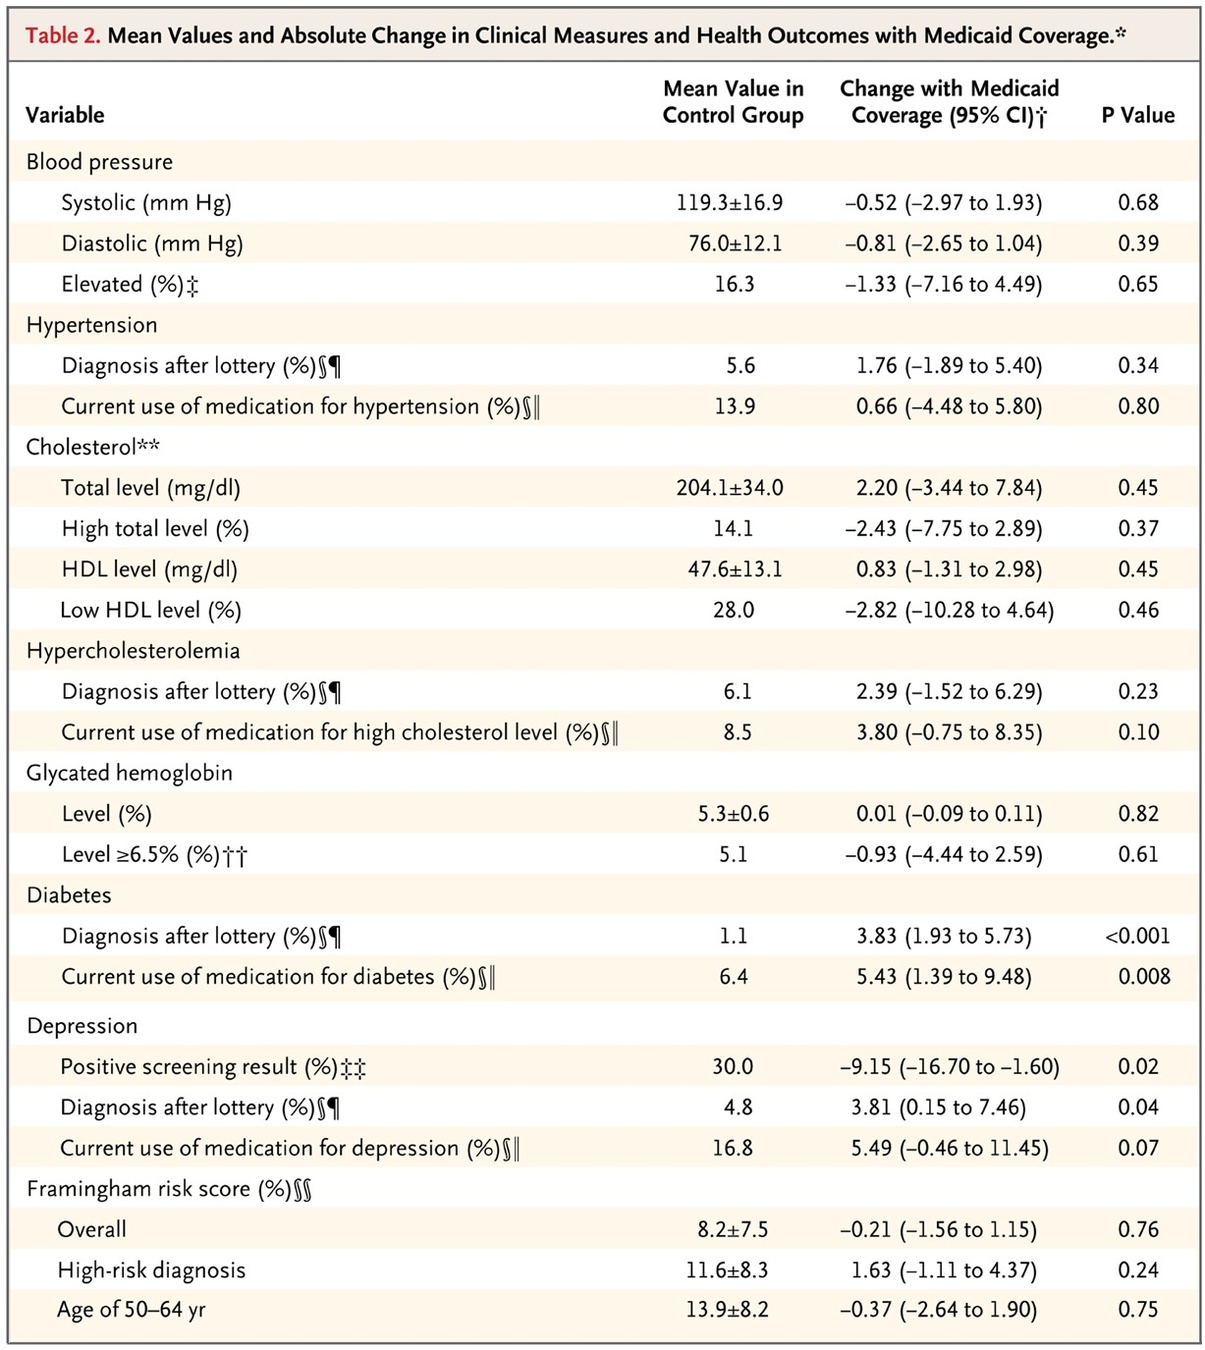
Baicker et al NEJM 2013
Non-Medical Care Determinants of Health
Factors affecting health not directly related to medical care:
Education
Nutrition
Racism
Substance abuse
Housing stability
Environmental quality
Behaviors
Peer Effects
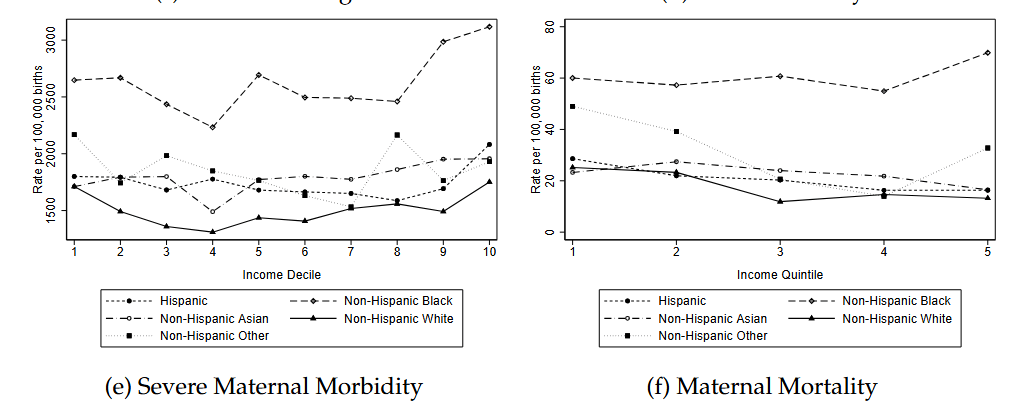
Racial and Ethnic Disparities in Health
Much higher mortality rates for non-Hispanic Black vs non-Hispanic white or Hispanic (although some convergence in recent years)
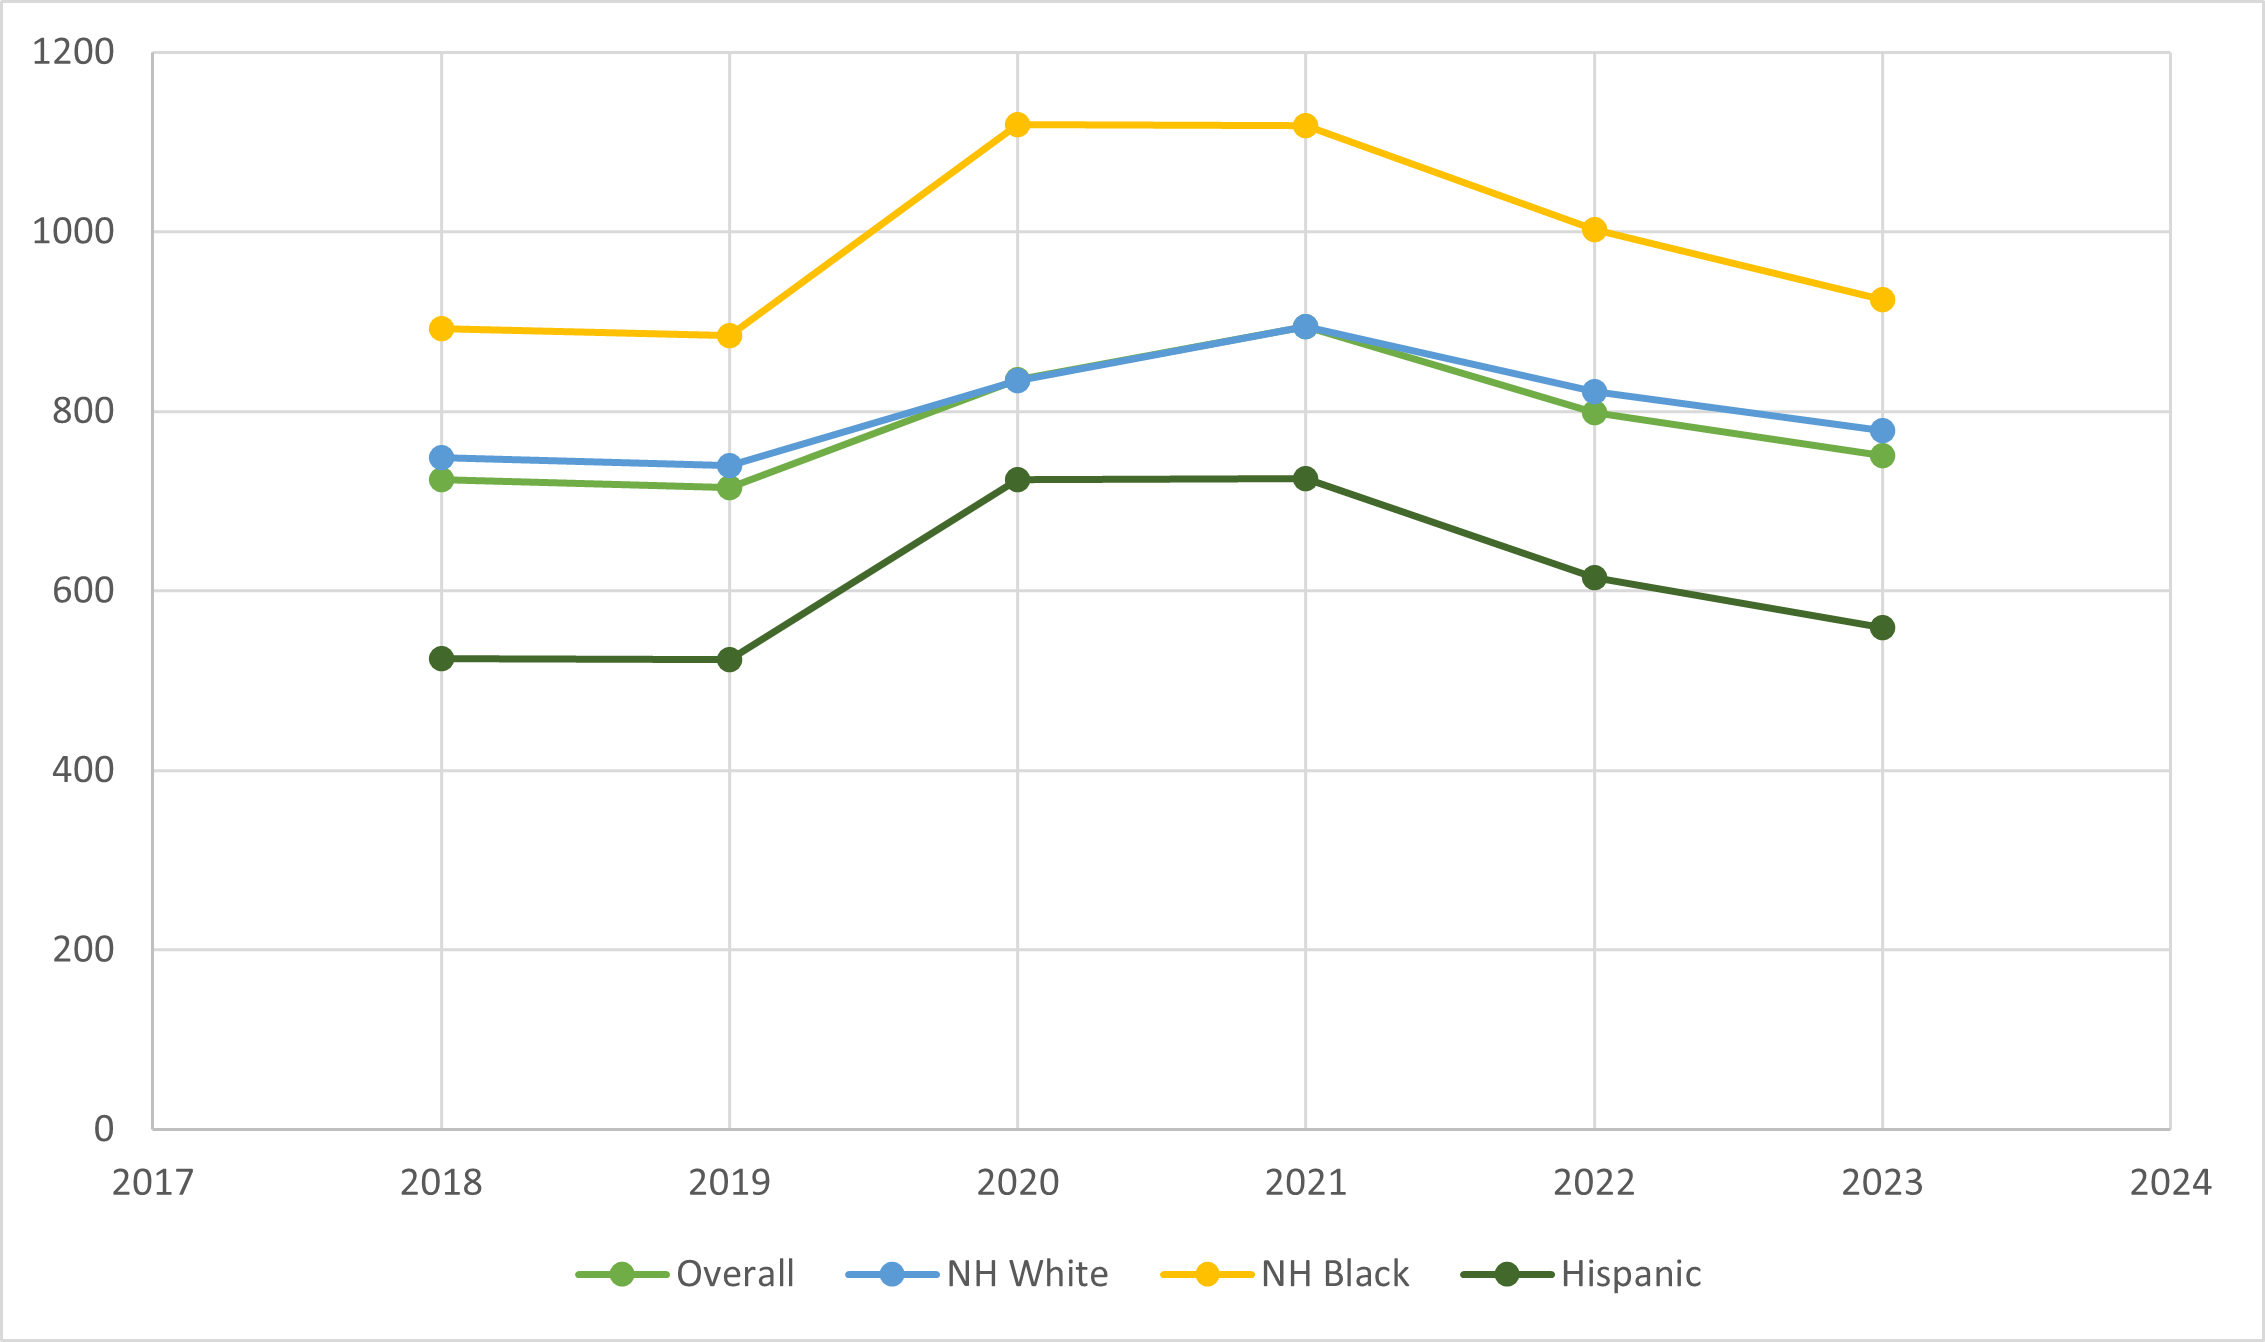
Racial and Ethnic Disparities in Health
Data from California.
Kennedy Moulton et al. 2025
Racism and Racial Disparities in Health
What underlies these disparities? It's hard to fully quantify but researchers have investigated different hypotheses:
Structural factors rooted in segregation and historical disinvestment.
History of abuse by medical system resulting in distrust (e.g., Tuskegee).
Current unfair treatment by individual medical practitioners.
Lower rates of health insurance coverage and higher rates of reports of skipping medical care due to cost among Black Americans.
These are difficult to address!
Racism and Racial Disparities in Health
Growing rates of substance abuse, suicide
Case and Deaton PNAS 2015: document rising mortality rates among those with low levels of education.
- Driven by a combination of suicides and drug overdose.
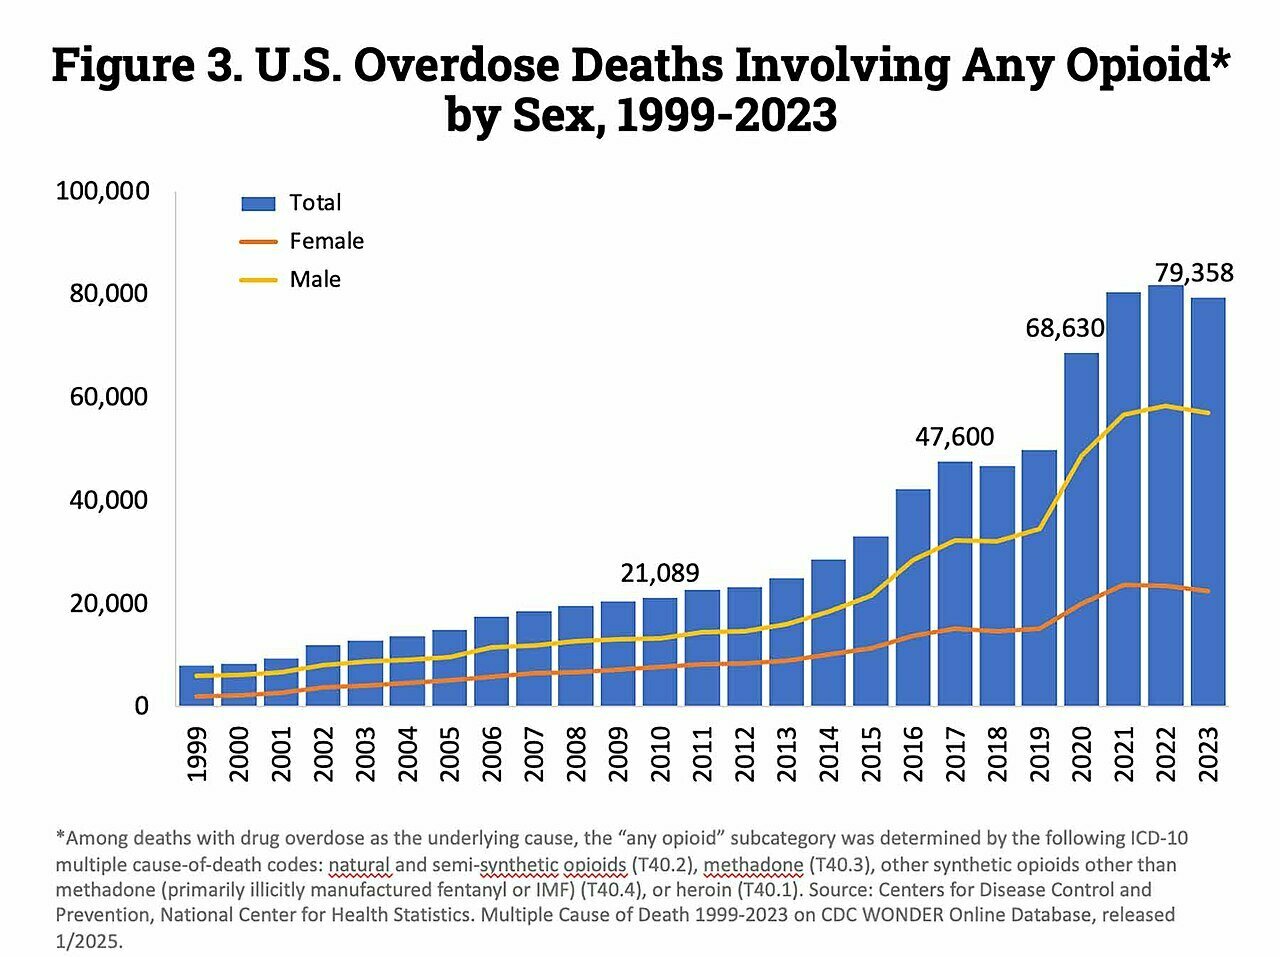
Determinants of Health
In 2023: about 40k deaths from car accidents. Nearly 80k deaths from opioids.
Source: CDC

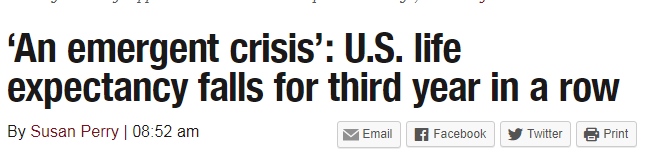
Opioid Crisis
Vox Media, based on data from the UN International Narcotics Control Board
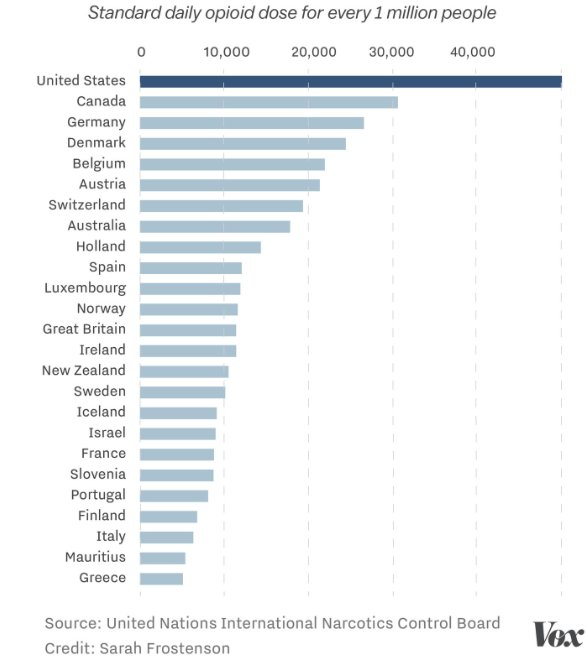
Opioid Crisis
Source: CDC Report
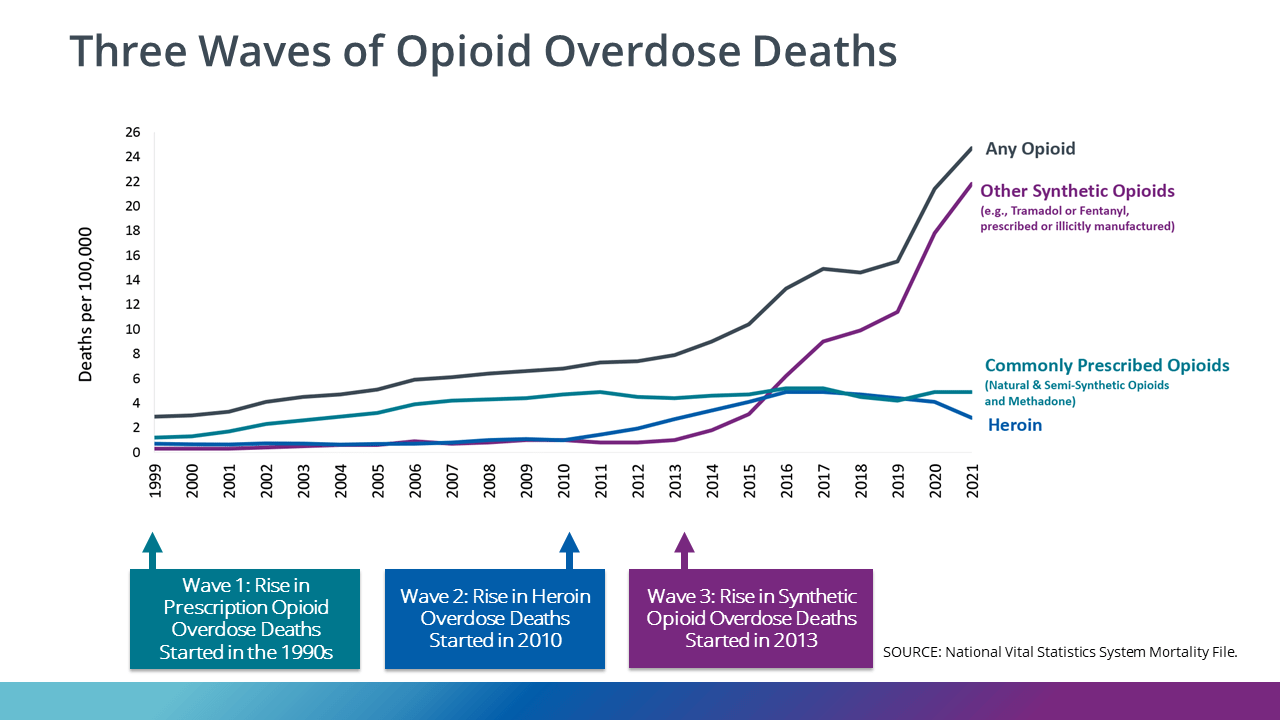
Drivers of the opioid epidemic
- Misleading marketing from Purdue Pharma ($7.4bill settlement mostly paid for by Sackler family).
- Initially sought to limit liability via Chapter 11 which led to a Supreme Court case.
- "Pay for performance" measures for physicians that included pain management as a performance metric.
- Reformulation of OxyContin led to the growth of heroin abuse.
- About 75% of heroin users started with prescription painkillers (Cicero et al. 2016 JAMA Psychiatry).
- Rise of cheaper to make (and deadlier) fentanyl.
Are Companies Buying It?
United HealthCare covers 6.4 million Medicaid beneficiaries.
A small percentage of them account for a large amount in spending.
(Quote from Forbes, 2018):
"A homeless man in Phoenix named T.J. made 254 trips to the emergency room, had 32 hospital admissions and cost UnitedHealth Group, the nation’s largest health insurance company, and the U.S. healthcare system more than $294,000 since 2015."
- Moved to temporary housing
- Helped apply for disability
- Counseling for depression
Are Companies Buying It?
“Social determinants of health, like food security or stable housing issues, sit upstream from and weigh heavily on gaps in care,” UnitedHealthcare CEO Steve Nelson told analysts on the company’s first quarter earnings call. “Data from other countries and our own experience indicate social investments reduce health care costs, and addressing these social determinants is the next frontier in serving the whole person here in the U.S. "
- Anthem and UnitedHC both making substantial investments (over $350 mil and $1B respectively) in affordable housing for their Medicaid populations.
Is the Best Health Care Dollar not Spent on Health Care?
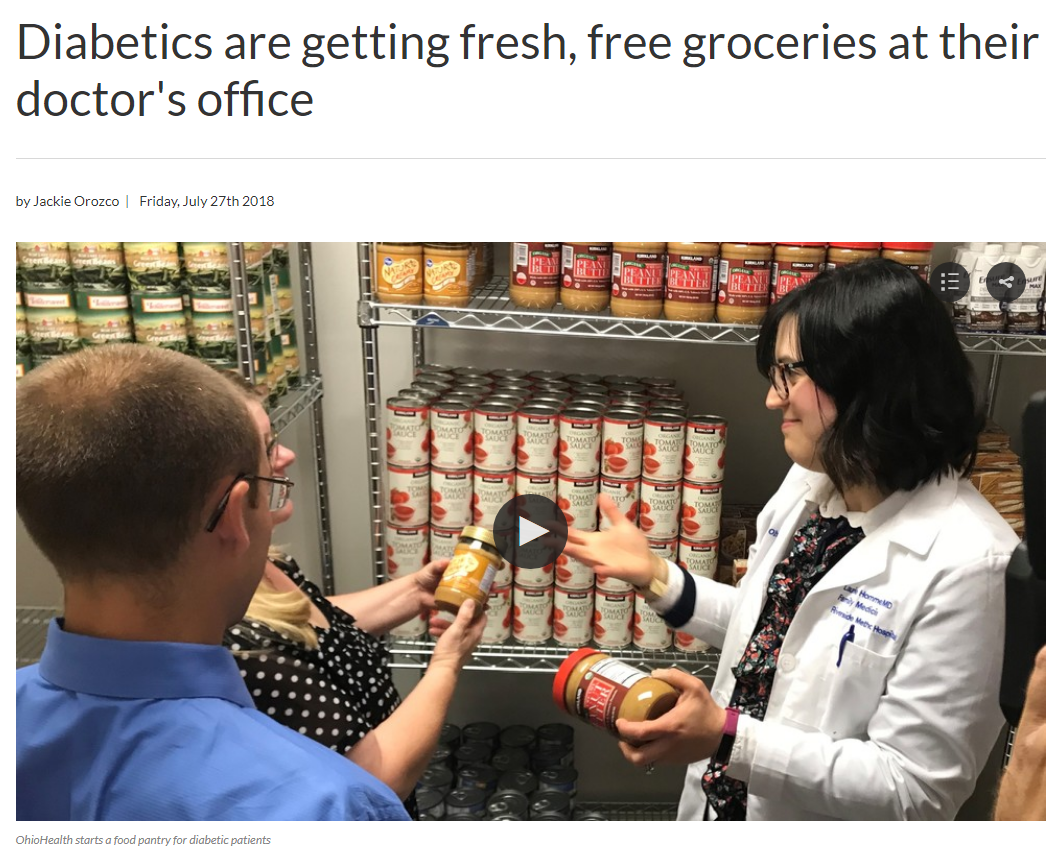
Source: ABC News. Ohio Health family practice partnering with local food banks to provide nutrition support. Costs ~$7 per person.
The $1.5 trillion question: does it work?
Everyone wants to reduce cost and improve outcomes.
Is the path forward through targeting healthy behavior, the environmental setting, access to housing, nutritional assistance or cash assistance (or something else)?
Companies are eager for an answer to this question!
Camden Coalition and Hotspotting
Healthcare hotspotting
is the strategic use of data to reallocate resources to a small subset of high-needs, high-cost patients.
- Super-utilizers, small number of patients with complex, hard-to-manage needs and chronic conditions, can generate a lot of costs.
- Underlying some of the strategies described by United and other Medicaid insurers
The $1.5 trillion question: does it work?
Randomized controlled study of the Camden Coalition "hotspotter" program:
- We randomly assigned 800 hospitalized patients with medically and socially complex conditions, all with at least one additional hospitalization in the preceding 6 months, to the Coalition’s care-transition program or to usual care. The primary outcome was hospital readmission within 180 days after discharge.
- The 180-day readmission rate was 62.3% in the intervention group and 61.7% in the control group. The adjusted between-group difference was not significant (0.82 percentage points; 95% confidence interval, −5.97 to 7.61).
Finkelstein, Zhou, Taubman and Doyle
New England Journal of Medicine 2019
The $1.5 trillion question: does it work?
One attempted solution for firms: the "Workplace Wellness" program.

Offer incentives to lose weight, quit smoking, visit the gym more etc.
Currently 50 million employees have access to these types of programs, and firms with these programs spend on average $742 per employee, according to a recent United HC survey. An $8 billion industry!
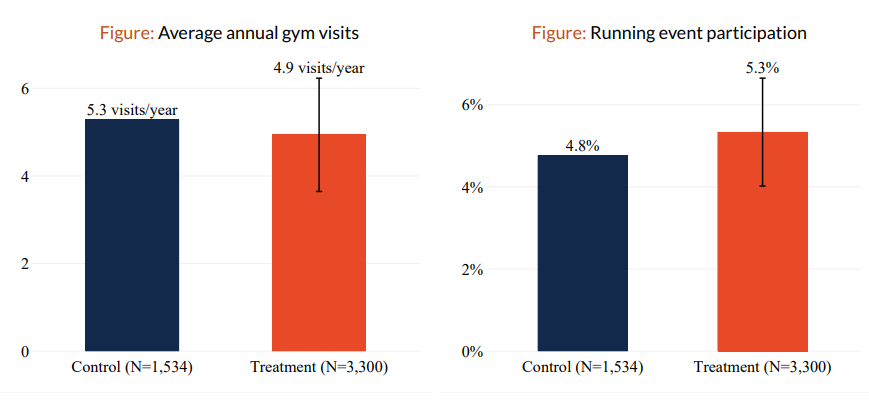
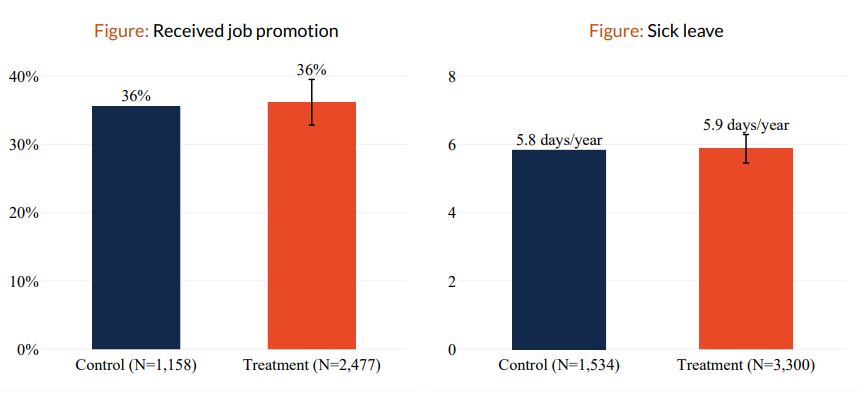
Workplace Wellness Randomized Controlled Trial
Jones, Molitor and Reif 2019 randomly assigned eligibility for a workplace wellness program, and the size of financial incentives, at the University of Illinois.
Wellness program offered employees an incentive of $75 per semester if they engaged in at least one "wellness activity" that met once a week for 6 to 12 weeks, plus $200 for signing up and taking a health risk assessment.
E.g., weight watchers, stress management class, smoking cessation program
Workplace Wellness Randomized Controlled Trial
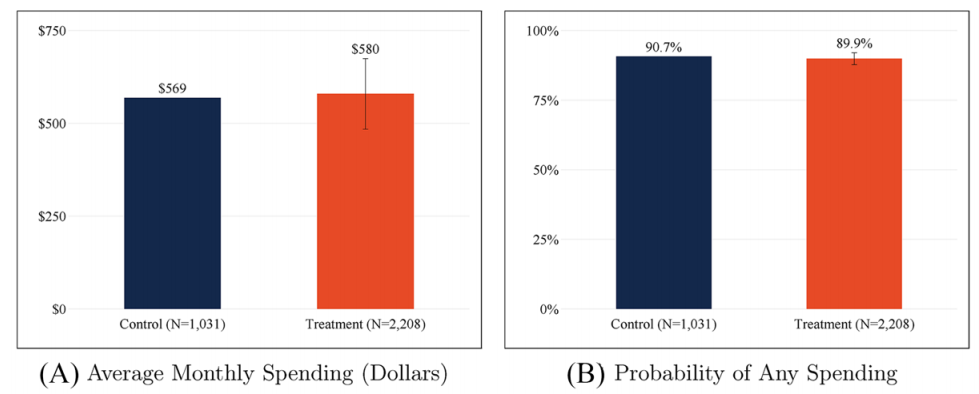
Workplace Wellness Randomized Controlled Trial
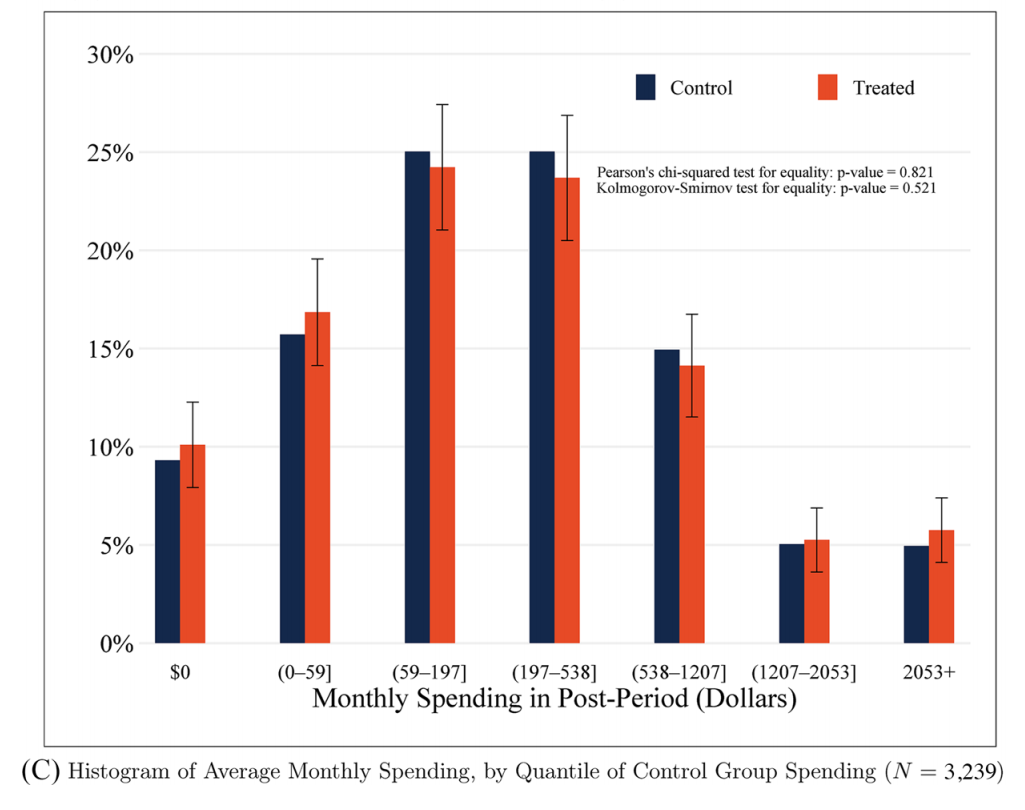
Workplace Wellness Randomized Controlled Trial
Workplace Wellness Randomized Controlled Trial
Workplace Wellness Randomized Controlled Trial
Authors find that previous literature looking at differences across wellness plan participants and non-participants was driven by selection, i.e. those who choose to participate in a wellness program tend to be healthier anyway.
- If workplace wellness programs save employers money, it is only because it is a "perk" that helps retain healthy employees and not sick employees.
Workplace Wellness Randomized Controlled Trial
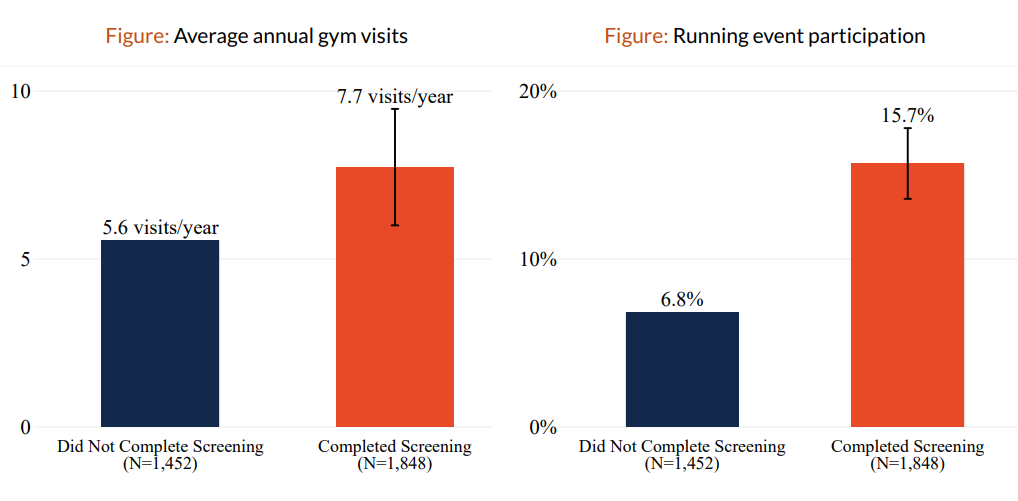
Who signed up (red) versus who didn't (blue)
How about just giving cash?
OpenResearch Unconditional Income Study: Randomized controlled trial with 1000 low-income adults receiving $1000/month for 3 years, control group of 2000 receiving $50/month for same period.
- Big improvements in mental health in year 1 but faded out by year 2.
- No change in measures of physical health, like self-reported health or blood pressure.
- Some increase in the use of medical care (hospital, ED, dental) but no changes in behaviors like nutrition, sleep quality, exercise; little change in feelings of access to care.
There were other beneficial effects (like better parenting, more investment in kids, better credit outcomes) but results for health were disappointing.
Still a lot to learn
Do social and economic factors "matter" for health?
Almost certainly yes.
But how can individual firms, providers, payors etc. harness them into effective interventions?
-Still unclear and more to learn--but a great opportunity!
Course evaluations!
Don't forget to fill out your course evals!
Your feedback is important to me!
Please take this extra time to complete the course evaluations.
(Bonus slides)
Nutritional Inequality
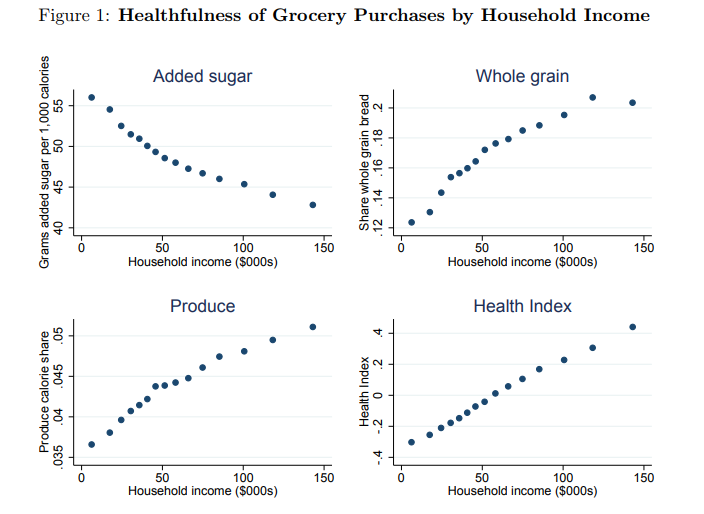
Allcott et al. 2019 Quarterly Journal of Economics based on Neilsen Scanner Panel
Nutritional Inequality
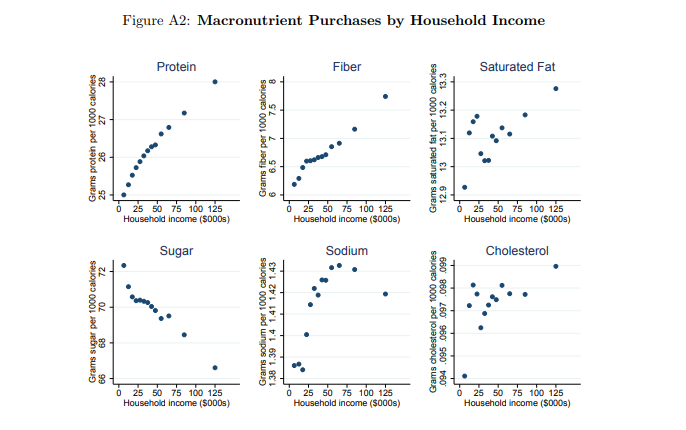
Allcott et al. 2019 QJE
Nutritional Inequality
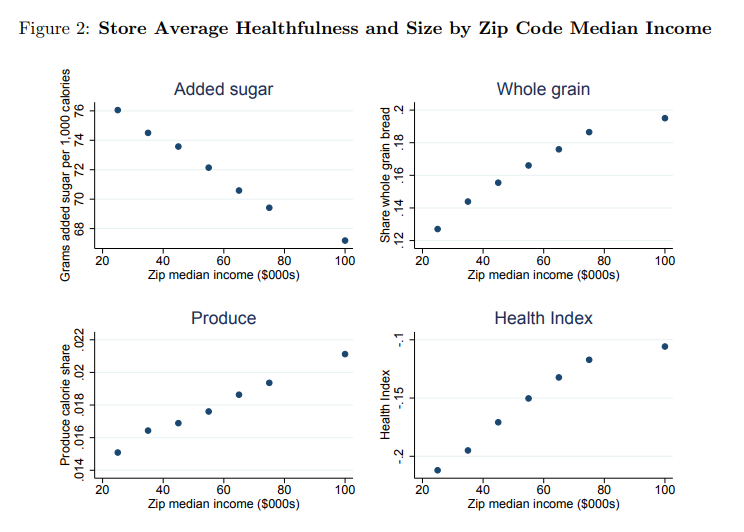
Why? Differential availability: explains only about 10%
But lowering the prices on healthy food could eliminate disparities (at a cost of about 15% of the FNS budget)
Nutritional Inequality

Copy of Lecture 5
By umich


